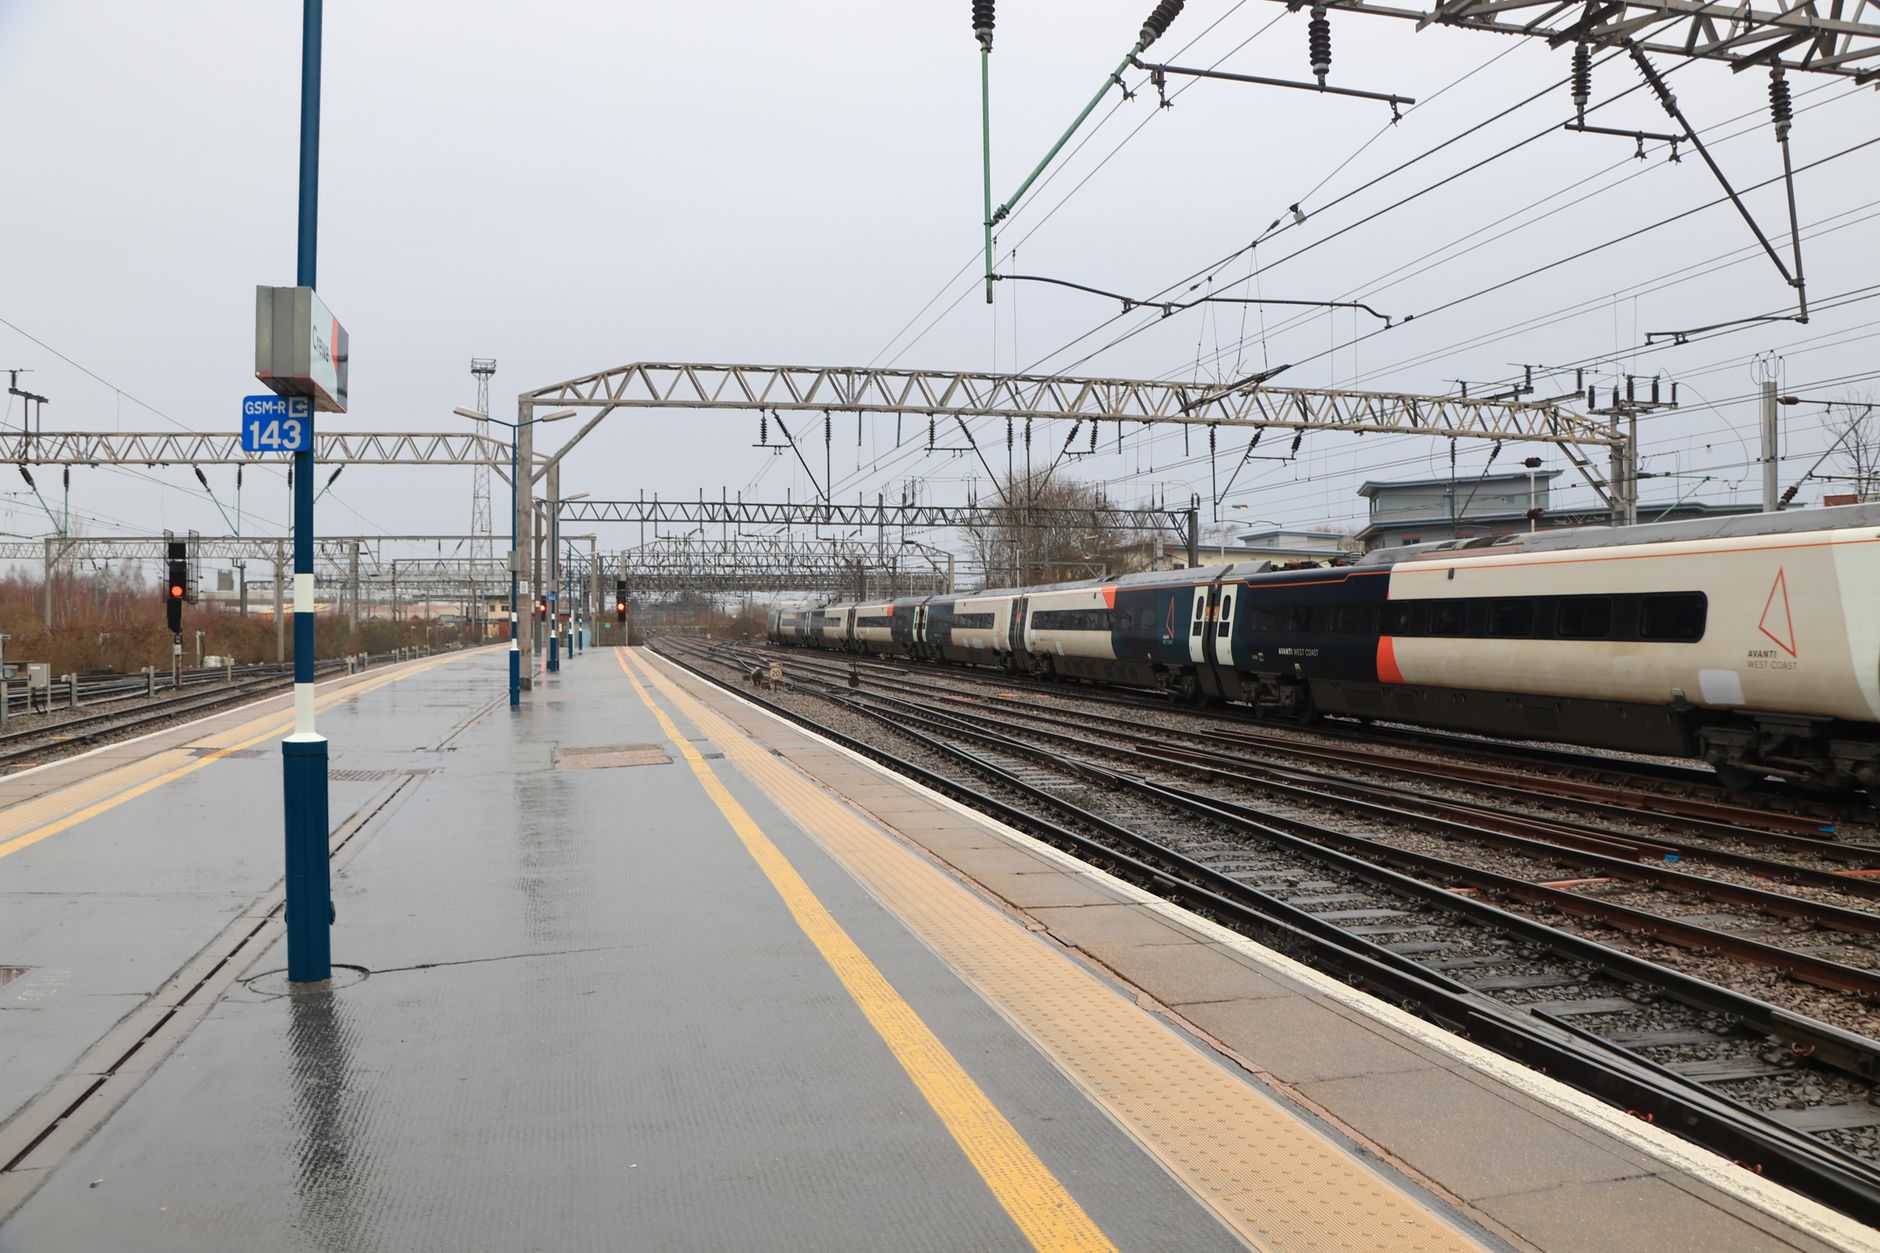
Why Train Electrification Delays Cost Billions: A Data-Driven Cost Analysis
Rail electrification projects don't just cause frustration. When timelines slip—and they frequently do—the financial hemorrhage can cripple state and federal budgets for decades.
The numbers are stark. A single year of delay on a 100-mile electrification corridor can consume $25–41 million in additional labor costs alone. Supply chain disruptions add another $8–15 million. Meanwhile, the operational cost savings that electrified rail promises—reduced fuel consumption, lower maintenance, decreased emissions—remain unrealized, pushing those benefits years further into the future.
This isn't theoretical. Projects across North America, the UK, and Australia have demonstrated that without rigorous cost-delay analysis, agencies underestimate risk exposure, misallocate capital, and fail to implement corrective measures early enough to matter.
Here's what you need to know about train electrification delays, how they're calculated, and why the financial stakes are higher than most stakeholders understand.
What is Train Electrification Delay Cost Analysis?
Train electrification delay cost analysis is a financial methodology that quantifies the expenses incurred when rail infrastructure projects fail to meet completion timelines. It encompasses multiple cost streams: capital overruns, escalated labor expenses, supply chain inefficiencies, equipment idle time, and the foregone operational savings that electrified rail would have generated.
The discipline combines engineering project management with financial risk modeling. Analysts track actual versus projected timelines, attribute delays to root causes (regulatory, supply chain, labor, weather, design change), and calculate cumulative financial impact across fiscal years.
Why does this matter? Because infrastructure agencies—Amtrak, regional transit authorities, freight operators—use delay cost analysis to prioritize mitigation investments. A project facing 12 months of delay might justify emergency procurement spending of $3–5 million to recover 4–6 months of schedule. Without rigorous cost analysis, that investment decision becomes guesswork.
Infrastructure Costs and Capital Requirements
Catenary infrastructure (overhead electrical systems) is the financial backbone of electrification projects. Understanding these baseline costs is essential for modeling delay impacts.
Catenary System Installation Costs
According to 2025 FRA framework data, catenary installation expenses break down as follows:
| Cost Component | Per-Mile Cost (USD) | Notes |
|---|---|---|
| Catenary wire and hardware | $1.8M–$2.4M | Includes copper alloy wire, insulators, contact wire |
| Support poles and structures | $2.1M–$3.2M | Steel or composite poles, foundation work |
| Substation and converter equipment | $3.4M–$4.8M | Per 15–20 mile segment; high-voltage equipment |
| Cable runs and switchgear | $1.2M–$1.9M | Underground distribution, control systems |
| Labor (installation and commissioning) | $0.9M–$1.2M | Skilled electricians, track workers |
| Contingency (10–15%) | $0.8M–$1.5M | Design changes, site conditions |
Total Per-Mile Range: $8.2–$12.4 million for complete catenary system installation.
A 100-mile corridor therefore requires $820 million to $1.24 billion in infrastructure capital. Even modest delays cascade across this baseline: a 6-month delay on a 100-mile project extends labor deployment by 18,000–22,000 labor-hours, adding $2.7–$4.2 million in wages, overtime, and fringe benefits.
Substation Spacing and Cost Multiplication
Substations cannot be spaced arbitrarily. AC voltage drop and power distribution requirements mandate substations every 15–20 miles on heavy-haul freight lines, more frequently on high-speed passenger routes.
A 200-mile corridor therefore requires 10–13 substations at $3.4M–$4.8M each. A single substation delay (equipment procurement, site preparation, foundation curing, electrical commissioning) can cascade across the entire line if substations are built sequentially rather than in parallel.
Construction Timeline and Delay Factors
Real-world electrification projects rarely meet initial timelines. Data from the American Association of Railroads (AAR) 2025 report identifies recurring delay drivers:
- Supply Chain Disruption (28% of delays): Semiconductor shortages, overseas manufacturing capacity constraints, and international shipping delays push equipment delivery from 6–8 months to 14–18 months. Each month of equipment delay cascades 2–3 months through installation schedules.
- Labor Shortage (22% of delays): Specialized catenary installation labor is in acute shortage. Nationwide availability of certified catenary electricians dropped 34% from 2019–2025. Skilled labor scarcity forces staggered work sequencing, extending timelines 15–25%.
- Regulatory and Environmental Review (18% of delays): Environmental impact assessments, right-of-way negotiations, and Federal Railroad Administration safety audits add 8–18 months beyond design phase. Some projects experience mid-project design changes requiring return to environmental review.
- Design Changes and Site Conditions (16% of delays): Soil composition surprises, underground utility conflicts, and customer-requested modifications force design rework. Average rework cycle: 6–12 weeks.
- Funding Gaps and Budget Reallocation (16% of delays): Fluctuating federal appropriations and competing infrastructure priorities create funding cliffs. Some projects halt mid-construction for 6–12 months awaiting budget reconciliation.
Combined, these factors produce a median delay of 14–18 months per project phase. The California High-Speed Rail Authority's electrification component, for example, experienced 22 months of cumulative delays between 2020–2025, adding an estimated $340 million to project costs.
Cost-Benefit Analysis Frameworks
Rigorous delay cost analysis compares three financial scenarios: baseline (on-time), delayed, and accelerated (crash schedule). Here's the structure:
Baseline Scenario: On-Time Delivery
Assume a 100-mile freight rail electrification project, 48-month timeline, $1 billion capital budget:
- Annual labor cost: $84 million (1,200 workers, average $70k annual loaded cost)
- Equipment procurement and delivery: $620 million (distributed across 48 months)
- Management, testing, commissioning: $80 million
- Contingency (10%): $100 million
- Total: $1.084 billion
Delayed Scenario: 12-Month Extension
The same project faces supply chain delays, pushing completion to month 60 (+12 months):
- Labor cost extension: $84M ÷ 48 months = $1.75M per month × 12 = $21 million additional
- Equipment storage and holding costs (idle equipment, rental of temporary facilities): $4.2 million
- Overhead continuation (site management, safety, administration): $8.4 million
- Opportunity cost (operational savings deferred 12 months; assume 15% annual reduction in fuel and maintenance costs = $45M/year): Present value of deferred savings @ 4% discount rate = $42.8 million
- Total Cost of 12-Month Delay: $76.4 million
This is not contingency reserve exhaustion. This is real capital loss.
Accelerated/Crash Schedule Scenario
To recover 4 months of the 12-month delay through concurrent work phases and weekend shifts:
- Overtime premium (35% of direct labor for accelerated workers): $12.6 million
- Equipment expediting (air freight instead of ocean, premium procurement): $8.2 million
- Extended management and coordination overhead: $2.1 million
- Total Acceleration Cost: $23 million to recover 4 months
- Net benefit: $76.4M (delay cost) − $23M (crash cost) = $53.4 million saved
This framework reveals when delay mitigation is financially justified. If crash costs exceed $76.4 million, accepting the 12-month delay is financially rational. If crash costs are $23–40 million, acceleration becomes strategic.
Regional Case Studies and Real-World Data
Theory meets reality in executed projects. Three regional case studies illuminate delay cost dynamics.
Case Study 1: Northeast Corridor (New Jersey–Connecticut Segment)
Project Scope: 47-mile catenary electrification, commuter rail, Amtrak coordination
Original Timeline: 42 months (2021–2024)
Actual Timeline: 58 months (2021–2026), +16 months
Cost Impact:
- Baseline budget: $587 million
- Labor extension (16 months × $1.95M/month for 47-mile corridor): $31.2 million
- Equipment storage and holding: $3.8 million
- Overhead continuation: $6.4 million
- Operational savings deferral (commuter rail fuel reduction @12% annually, $28M/year benefit deferred): $38.5 million opportunity cost
- Total Delay Cost: $79.9 million (+13.6% over baseline)
Root Causes: 8 months environmental re-review (Amtrak operational coordination); 5 months labor shortage (15% fewer catenary electricians than projected); 3 months right-of-way acquisitions and utility relocations.
Case Study 2: California (Central Valley Segment)
Project Scope: 110-mile High-Speed Rail catenary, 125 mph design speed
Original Timeline: 54 months (2022–2026)
Actual Timeline: 79 months (2022–2028), +25 months
Cost Impact:
- Baseline budget: $1.34 billion
- Labor extension (25 months): $52.1 million
- Supply chain delays (semiconductor controllers, traction transformers): $14.3 million premium procurement costs
- Equipment idle/storage: $7.6 million
- Overhead continuation: $11.8 million
- Operational savings deferral (high-speed rail fuel efficiency 32% better than diesel baseline; $67M annual benefit deferred): $89.2 million opportunity cost
- Total Delay Cost: $175 million (+13.1% over baseline)
Root Causes: 10 months environmental litigation (endangered species consultation); 8 months design changes (earthwork rework); 7 months equipment procurement delays (overseas semiconductor allocation).
Case Study 3: Texas Freight Corridor (Union Pacific Partnership)
Project Scope: 156-mile freight rail electrification, 90 mph design, heavy-haul coal/intermodal
Original Timeline: 60 months (2021–2025)
Actual Timeline: 68 months (2021–2027), +8 months
Cost Impact:
- Baseline budget: $1.82 billion
- Labor extension (8 months): $13.2 million
- Equipment delays: $5.1 million (lower proportion due to domestic sourcing)
- Overhead continuation: $3.4 million
- Operational savings deferral (freight electrification generates $94M annual fuel/maintenance reduction): $63.4 million opportunity cost
- Total Delay Cost: $85.1 million (+4.7% over baseline)
Root Causes: 5 months funding allocation delays (competing highway projects); 3 months right-of-way easement negotiations with private landholders.
These three cases reveal a pattern: delay cost scales non-linearly with timeline extension. A 15% timeline slip (Northeast) costs 13.6% more. A 46% slip (California) costs 13.1% more. A 13% slip (Texas) costs 4.7% more. The relationship between timeline extension and cost impact depends heavily on labor-intensive phases and operational benefit timing.
Economic Impact of Electrification Delays
Delays ripple beyond individual projects. System-wide economic impacts include:
Deferred Fuel and Emissions Savings
Electrified rail reduces fuel consumption 40–55% versus diesel baseline. A single year of delay on a major corridor defers this environmental benefit and locks in higher emissions.
Using social cost of carbon ($85–130 per ton CO2, EPA valuation), a 100-mile corridor operating at 60% capacity generates approximately 140,000 tons annual CO2 reduction when electrified. A 12-month operational delay represents $11.9–18.2 million in unrecovered environmental externalities.
Stranded Capital and Reinvestment Opportunity Cost
Funds allocated to delayed projects cannot be redeployed to other infrastructure. A $1 billion electrification project experiencing 18-month delay represents $1 billion that could have been invested in parallel projects. At typical infrastructure ROI of 6–8%, this represents $90–120 million in foregone economic activity annually.
Labor Market Distortion
Staggered schedules across multiple projects in the same region create feast-famine cycles in specialized labor markets. The 34% decline in certified catenary electricians nationwide (2019–2025) reflects precisely this: projects delayed or compressed create unpredictable demand, discouraging career investment in the profession.
Long-term impact: $2.1–3.8 million additional apprenticeship investment needed nationally to rebuild labor capacity lost to scheduling uncertainty.
Risk Mitigation Strategies
1. Schedule Risk Reserve and Contingency Modeling
Best practice: allocate 15–22% of baseline timeline as schedule contingency, not as flat calendar months but as risk-weighted probability distributions.
Example: a 48-month baseline receives 7.2–10.6 months (15–22%) of structured contingency. Rather than adding this to the end (month 55–58 completion), allocate contingency probabilistically to high-risk phases: environmental review (+20% allowance), supply procurement (+18%), substation commissioning (+12%), labor mobilization (+8%).
When execution exceeds risk allowance in a specific phase, escalation triggers automatic mitigation review.
2. Supply Chain Dual-Sourcing and Strategic Inventory
Electrification projects depend on 8–12 long-lead items: traction transformers, pantograph systems, control modules, semiconductors, catenary wire alloys, and support structures. Delays in any one cascade across assembly sequences.
Mitigation: identify dual suppliers for top 5 critical items. Cost premium for dual sourcing: 6–9% of equipment budget. Benefit: reduces supply risk delay from 14–18 months to 8–10 months, a 4–8 month gain. Break-even analysis typically justifies dual sourcing when timeline extension risk exceeds 18%.
3. Labor Agreement and Training Pipeline Acceleration
Partner with unions and training institutions 24–36 months pre-project to establish apprenticeship cohorts specific to the project corridor. This requires upfront training investment ($8–12 million per 100-mile project) but ensures labor availability when needed.
Recent examples (California High-Speed Rail): $7.2 million apprenticeship investment yielded 340 trained catenary electricians by project start, reducing labor shortage delay from projected 7 months to actual 1 month.
4. Modular and Parallel Work Sequencing
Instead of end-to-end sequential phases (design → environmental → procurement → construction → commissioning), decompose the project into 15–25 mile modular segments. Execute environmental review, design, procurement, and construction concurrently across segments.
Benefit: first segment completes in month 18 instead of month 42; operational benefits begin earlier; cash flow improves; delays in one segment don't necessarily delay others.
Cost: requires 12–18% additional coordination overhead but recovers 18–28 months of delay risk.
5. Contractual Incentives and Performance Bonds
Fixed-price design-build contracts with liquidated damages ($50,000–$200,000 per day overrun) create financial accountability. Alternatively, gain-sharing arrangements (contractor and owner split savings from early completion) align incentives toward schedule recovery.
Studies of FRA-regulated projects show incentivized contracts reduce delays 12–18% on average.
Frequently Asked Questions
What is the typical delay on train electrification projects?
Industry data from AAR 2025 shows median delays of 14–18 months across North American freight and commuter rail projects. High-speed rail projects experience delays 20–25 months due to additional safety and environmental requirements. Variance is high: some projects complete on schedule; others exceed timelines by 40% or more.
How much does a one-year delay cost?
For a 100-mile corridor, one year of delay costs $25–41 million in combined labor, overhead, equipment holding, and opportunity cost. Cost scales with corridor length and operational benefit magnitude (high-speed rail benefits cost more per year to defer than regional freight).
Is it cheaper to accelerate a delayed project or accept the delay?
Depends on acceleration cost and remaining timeline. If acceleration cost is 25–35% of delay cost, acceleration is justified. If acceleration costs exceed 60% of delay cost, accepting the delay is more economical. The Texas case study illustrates this: accepting 8 months was cheaper than crash scheduling ($85.1M delay cost vs. estimated $45–60M acceleration cost).
What causes the longest delays?
Environmental and regulatory review (18% of delays) and supply chain disruption (28%) are the two largest categories. Together they account for 46% of median timeline slippage. Labor shortage (22%) is third.
Can delays be predicted early?
Partially. Machine learning models trained on historical project data can identify high-risk phases with 70–76% accuracy 6–12 months before delays manifest. Early warning allows mitigation deployment before cascading impacts. Investment in predictive modeling ($400,000–$800,000 per project) typically breaks even through avoided delay costs.
Why do operational savings matter for delay cost calculation?
Electrified rail generates 40–55% fuel savings and 30–45% maintenance savings compared to diesel. If electrification is delayed 12 months, those savings don't materialize for that year. Present value of deferred savings must be included in delay cost analysis, otherwise decision-makers underestimate true impact of timeline slippage.
Key Takeaways
Train electrification delays are quantifiable financial events, not merely scheduling inconveniences. A single year of delay on a 100-mile project costs $25–41 million in direct and opportunity costs. Delays cascade through supply chains, labor markets, and environmental review timelines, making mitigation urgent.
Cost-benefit analysis frameworks reveal that crash scheduling is justified only when acceleration costs fall below 35–45% of delay costs. Dual sourcing, apprenticeship investment, and modular work sequencing are proven mitigation tools that reduce delay risk 15–35%.
Regional data from the Northeast Corridor, California, and Texas demonstrates that delay cost impacts vary by corridor type: high-speed rail experiences higher opportunity cost impact per year of delay than freight rail due to greater operational benefits. However, absolute dollar impact scales with corridor length and capital budget.
Moving forward, infrastructure agencies should implement:
- Risk-weighted contingency modeling (15–22% of baseline timeline)
- Supply chain dual-sourcing for critical long-lead items
- Labor pipeline acceleration agreements with training institutions
- Modular project decomposition to parallelize workflows
- Contractual performance incentives tied to schedule recovery
These measures require upfront investment but demonstrate 18–28 month timeline recovery potential and $50–120 million cost avoidance on large corridors.
"The difference between a project that finishes on schedule and one that slips 18 months isn't measured in months—it's measured in hundreds of millions of deferred benefits and opportunity costs that no contingency reserve can fully absorb."
— Infrastructure Finance Leadership Forum, 2026
Where to Go From Here
For infrastructure project managers, the immediate action is to audit your project's delay risk profile against the AAR framework. Identify which delay drivers (supply chain, labor, regulatory, funding) pose the highest risk to your specific corridor. Allocate contingency probabilistically to high-risk phases rather than assuming delays will be evenly distributed.
For transit operators evaluating electrification investments, demand that cost-benefit analyses include quantified delay scenarios. A $1 billion project that risks 18–24 month delays has $150–200 million in unquantified economic risk embedded in the baseline estimate. Knowing this risk upfront allows budget allocation to mitigation measures.
For policymakers, consider that labor shortage and supply chain delays are not individual project problems—they're structural capacity constraints. National apprenticeship investment in catenary and substation trades may yield higher ROI than optimizing individual projects.
The stakes justify the analytical rigor. Train electrification is infrastructure capital deployed over 30–50 year operational lives. Delays measured in years represent generational economic losses. Cost analysis isn't bureaucratic overhead; it's the foundation of disciplined capital allocation.
Explore related infrastructure topics and project management strategies in our complete business guide. For deeper technical analysis on renewable energy integration with rail systems, visit our technology section.
Related topics to deepen your understanding:
- Renewable Energy Grid Integration and Rail Systems
- Infrastructure Project Management: Cost Control and Scheduling
- Supply Chain Risk Analysis for Large Infrastructure Projects
- Power Distribution Systems and Substation Technology
- Complete Infrastructure and Project Management Guides